Continuity Check | Position at the Turn
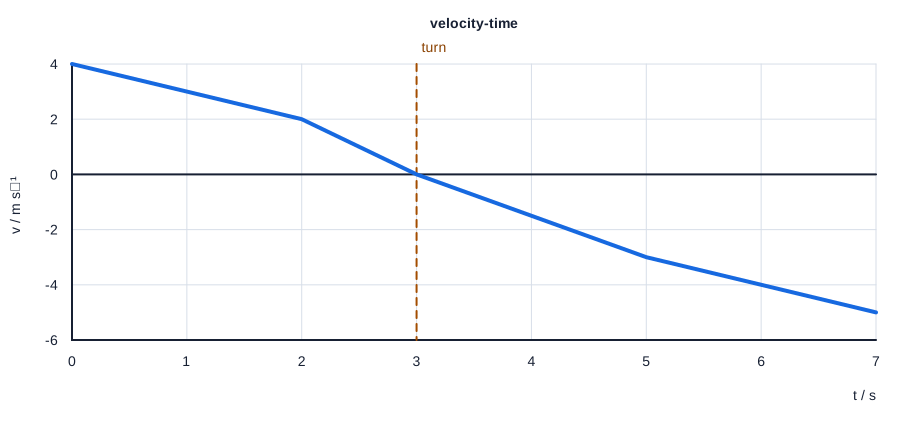
Figure 1 is a project-created velocity-time graph for a survey drone moving along a straight guide rail. Positive velocity is east.
Treat each straight section as exact.
- (a) Explain what happens to the position at , and why the position-time graph must remain continuous.
- (b) Determine the displacement from to and from to .
- (c) Explain why copying the shape of the velocity-time graph would not produce a correct position-time or acceleration-time graph.
Reveal Q2 (1)
The position reaches a maximum and the drone reverses direction. Position stays continuous because the drone cannot change location instantaneously.
At the zero crossing, the position-time gradient is zero. The gradient then changes sign, so the position has a smooth turning point.
Reveal Q2 (2)
followed by .
From to , the areas are . From to , the signed areas are .
Reveal Q2 (3)
Acceleration is the gradient of the velocity-time graph, while position changes according to its signed area; neither relationship is shape copying.
Use gradient to move from - to -, and signed area plus initial position to move from - to -.
Guided Translation | Velocity to Acceleration
Figure 1 is a project-created velocity-time graph for a survey drone moving along a straight guide rail. Positive velocity is east.
Treat each straight section as exact.
- (a) Describe the direction of motion and whether the drone is speeding up or slowing down during – and –.
- (b) Determine the acceleration from to .
- (c) Sketch the corresponding acceleration-time graph from to . Label the interval boundaries and acceleration values.
Reveal Q1 (1)
From to , the drone moves east and slows to rest. From to , it moves west and speeds up.
Before , but decreases toward zero. After , and its magnitude increases.
Reveal Q1 (2)
.
Reveal Q1 (3)
Piecewise constant negative acceleration: from –, from –, from –, and from –.
Calculate the gradient of each straight velocity-time segment and draw a horizontal acceleration segment for each interval.
Skydiver Overview | Release to Parachute Opening
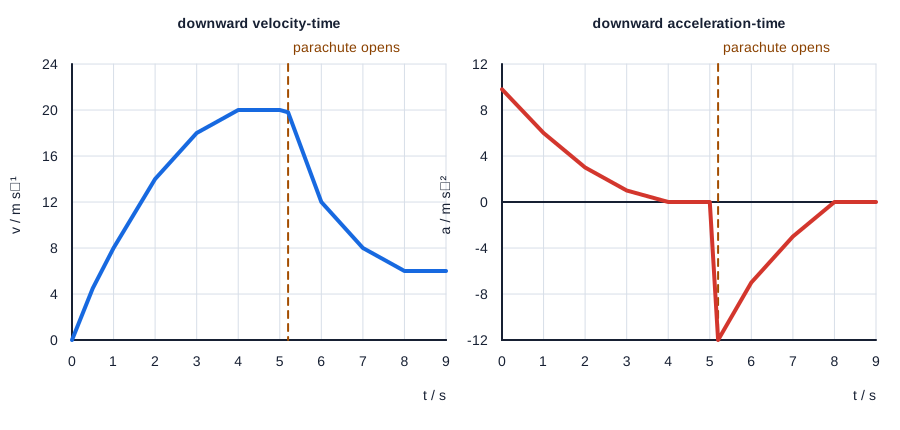
Figure 1 shows project-created linked graphs for a skydiver. Downward is positive. The parachute opens at .
The curves are qualitative models rather than measured data.
- (a) Explain why the acceleration is initially close to .
- (b) Explain why the velocity approaches a constant non-zero value before the parachute opens.
- (c) Immediately after the parachute opens, state the signs of velocity and acceleration and explain why the skydiver slows down.
Reveal Q3 (1)
The speed and drag are initially very small, so weight dominates and the downward resultant force is close to the weight.
At release, , so fluid resistance is negligible in the qualitative model.
Reveal Q3 (2)
As speed increases, drag increases. The resultant force and acceleration decrease to zero when drag balances weight, leaving constant non-zero velocity.
Terminal speed is a force-balance condition: zero resultant force gives zero acceleration, not zero velocity.
Reveal Q3 (3)
Velocity is positive and acceleration is negative. The acceleration opposes the velocity, so the speed decreases.
With downward positive, the still-downward motion has . Drag temporarily exceeds weight, so the resultant force and acceleration are upward, .
Linked Skydiver Check | Continuity and Lower Terminal Speed
Figure 1 shows project-created linked graphs for a skydiver. Downward is positive. The parachute opens at .
The curves are qualitative models rather than measured data.
- (a) Explain why velocity remains continuous when the parachute opens even though acceleration changes sharply.
- (b) State the acceleration at either terminal speed.
- (c) Explain why the magnitude of the upward acceleration decreases as the skydiver approaches the lower terminal speed.
Reveal Q4 (1)
The skydiver cannot change velocity by a finite amount in zero time; the parachute produces a large acceleration over a finite interval instead.
Acceleration is the gradient of velocity. A sharp gradient change is compatible with a continuous velocity curve.
Reveal Q4 (2)
.
Constant velocity has zero gradient, so acceleration is zero.
Reveal Q4 (3)
As the falling speed decreases, drag decreases. The difference between drag and weight becomes smaller, so the upward resultant force and acceleration magnitude approach zero.
The forces approach balance again at a smaller constant speed.
Position-Time Consequence | Gradient Approaches a Constant
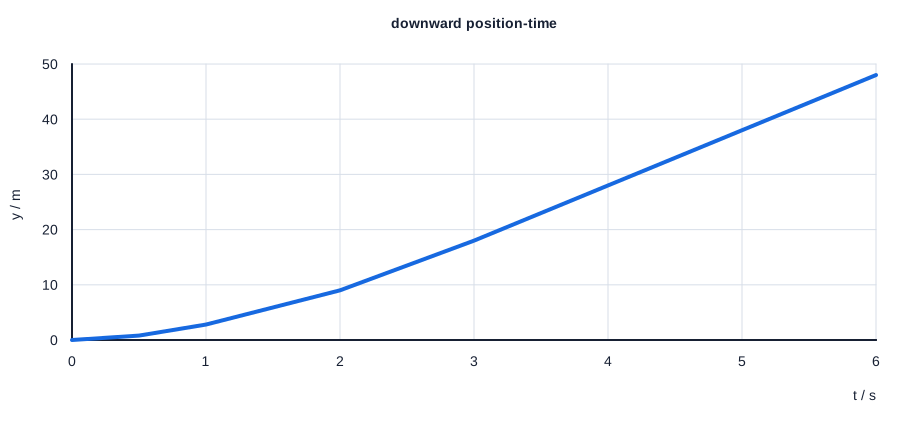
Figure 1 is a project-created downward-position-time graph for a falling capsule approaching terminal speed. Downward position is positive.
- (a) State the graph feature that represents the capsule's velocity.
- (b) Explain how the graph shows that the capsule starts from rest and approaches terminal speed.
- (c) Explain how the changing curvature is consistent with an acceleration that decreases toward zero.
Reveal Q5 (1)
The tangent gradient.
Velocity is the instantaneous rate of change of position.
Reveal Q5 (2)
The initial gradient is zero, then the gradient increases and approaches a constant non-zero value.
Rest corresponds to zero position-time gradient. Terminal speed corresponds to a constant non-zero gradient.
Reveal Q5 (3)
The gradient changes rapidly at first and then by progressively smaller amounts; when the gradient becomes constant, acceleration is zero.
Acceleration is the rate of change of velocity, so decreasing curvature indicates decreasing acceleration.
Independent Checkpoint | Graphs and Model Validity
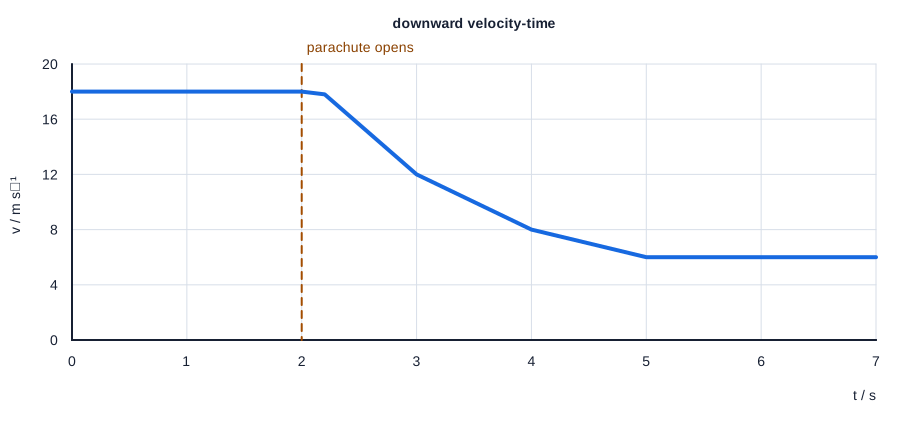
Figure 1 is a simplified downward-positive velocity-time graph for a parachutist. The parachute opens at .
- (a) State the velocity at .
- (b) Determine the acceleration from to .
- (c) Explain what the signs of velocity and acceleration show immediately after .
- (d) Explain how the graph represents velocity continuity at parachute opening.
- (e) Explain why one SUVAT model is invalid from to .
Reveal Q6 (1)
.
Read the ordinate from the first horizontal section.
Reveal Q6 (2)
.
The gradient of a horizontal velocity-time segment is zero.
Reveal Q6 (3)
Velocity is positive and acceleration is negative, so the parachutist is still moving downward but slowing.
Opposite signs of velocity and acceleration indicate decreasing speed.
Reveal Q6 (4)
The velocity line has no vertical jump at ; only its gradient changes sharply.
The parachute changes the force and acceleration, not the velocity instantaneously.
Reveal Q6 (5)
The velocity-time gradient changes: it is zero, then negative with changing magnitude, then zero again. One SUVAT model requires a single constant acceleration.
Graphical interval reasoning remains valid, but the complete motion does not have one constant acceleration.